Data Science and the GO language
GDP revisited, but now in GO
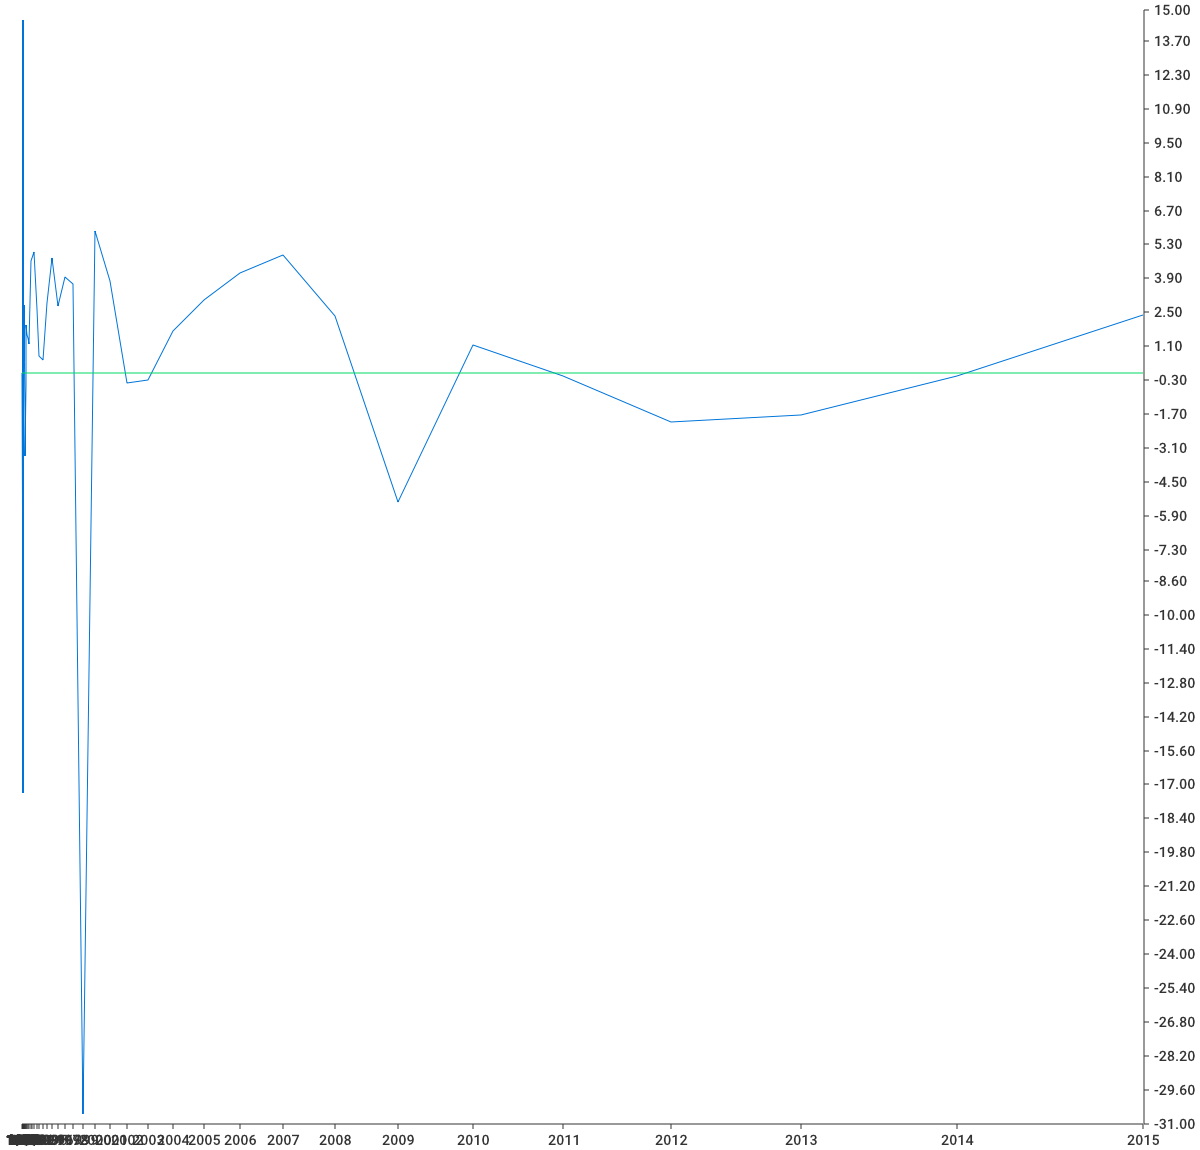
Remember SQL and window-functions? I tried to mimic the Dutch CBS GDP-graph in a fashion where the full context (full as in from the beginning of measuring GDP's) was in the graph without taking up too much space.
The figures where produced with SQL, the chart was created using the language R. R and Python are the languages mentioned most in the context of data science. Both R and python have a bad reputation when it comes to deployment. Dependency hell is quite normal and most developers don't care: “It works on my laptop, how hard can it be?”1
GO fixes this by depending on the OS' libc only. The compiled program has all modules and libraries statically available in the executable. But, is it fit for data analytics or data science?
After some looking around and skipping the all too enthusiastic stories of GO-fans, I encountered enough supporting packages to try out GO to produce a graph similar to the one I made in the title on windowing functions.
You may read this as another Literate Programming exercise, you may also read this as a critique on the GO language and its ecosystem.
The program
GO is a multi-purpose language and, as most OO-adepts will stress, can specialise without too much effort. The OO paradigm is very well suited for exactly this: specialising in a specific field.
Although most critics applaud this, they also come up with the major drawback: programmers are not designers. In an OO implementation of something, the programmers also designs an API for a specific class. This will hardly ever end up in being useful for others than this programmer, not even for his best mate (I'm exaggerating a bit).
With this in mind, I was curious how GO would do in a foreign field like data science.
As the R program is already written, I tried to port the code to GO using no-web notation for the abstract things and go-graph code inbetween. Because of big differences in the API, this couldn't work. In R I called some functions in order to draw upon a canvas and finally render it into the output device. In GO, with the available go-chart packages, datastructures are setup and filled with the appropriate values. Generating the chart into an image is the last thing to do.
Setting up the rendering
go-chart has a so-called Chart which is to be filled in with parameters (show X axis, or not), ticks (a static array for mapping axis-values to labels) and formatting (this is a callback function, called for every axis-value). Also, the type of chart is set and, last but not least, values for X and Y are filled in. 2
chart.Chart {
  Width:  1200,
  Height: 1150,
  XAxis: chart.XAxis{
          Style: chart.Style{
                  Show: true,
          },
          Ticks: getTicks( getbnps() ),
  },
  YAxis: chart.YAxis{
          Style: chart.Style{
                  Show: true,
          },
  },
  Series: []chart.Series {
     chart.ContinuousSeries {
       XValues: getX( getbnps() ),
       YValues: getY( getbnps() ),
     },
     chart.ContinuousSeries {
       XValues:
         []float64{0, math.Pow( <<base>>, float64(len( getbnps() ) ) )},
       YValues:
         []float64{0, 0},
     },
  },
}
After setting the width and height of the chart, the axis are set. As I use an exponential X-axes (which cannot be derived from the above code), I need to adapt the tick-labels too. I've abstracted that into some get-functions: getTicks, getX and getY. These all work on the data about bnp from the CBS.
The second series of X/Y-values is about the horizontal line at Y-value 0.▮
1.2
The base for the exponential x-axes is copied from the one used in SQL and window-functions.▮
The output file has a name:
"bnp-in-go.png"
Data from the database
In the R example, I used a fancy way of moving data from SQL-statements into R-code by org-babel, the org-mode-product which facilitates running code in a document. The org-babel plugin for GO doesn't do this (for now, I filed an issue on Github, volunteering as well).
So I will be using GO-code to retrieve the GDP-data from the
database. The package go-pg is used for that purpose.
The following code retrieves all GDP-rows (bnp in Dutch) from the database3.
type thebnp struct {
       Year       int
       Bnp        int
       Rank       int
       Bnpreldiff float64
       Inflation  float64
}

var bnps []thebnp

func getbnps() []thebnp {
  if len( bnps ) > 0 {
    return bnps
  }
  db := pg.Connect(&pg.Options{
                       User:     "joost",
                       Addr:     os.Getenv( "PGHOST") + ":"  +
                                 os.Getenv( "PGPORT"),
                       Database: "evlog",
                       Password: os.Getenv( "PGPASS"),
                   })
  defer db.Close()

  err := db.Model(&thebnp{}).Select(&bnps)
  if err != nil {
          panic( err )
  }
  return bnps
}
func getX( ar []thebnp ) []float64 {
  ret := make( []float64, len( ar ) )
  for ind, val := range ar {
    ret[ ind ] = math.Pow( <<base>>, float64( val.Rank ) )
  }
  return ret
}
func getY( ar []thebnp ) []float64 {
  ret := make( []float64, len( ar ) )
  for ind, val := range ar {
    ret[ ind ] = val.Bnpreldiff - val.Inflation
  }
  return ret
}
func getTicks( ar []thebnp ) []chart.Tick {
  ret := make( []chart.Tick, len( ar ) )
  for ind, val := range ar {
    ret[ ind ] = chart.Tick{math.Pow( <<base>>, float64( val.Rank ) ), fmt.Sprintf( "%d", val.Year )}
  }
  return ret
}
go-pg uses an object-relational-model for mapping tables onto
GO structs. It looks automatic, but it is not!
To the name of the struct, an “s” is added for the name of the table and fieldnames in the struct are downcased for attribute-names in the table. Fieldnames which start with a capital, that is. The ones which don't fit this, are ignored.
The code then is pretty straightforward and selects all rows of the table thebnps into an array of structures for later use by the get-functions. The code doesn't retrieve this set more than once by using the length of bnps as an indicator for previous work done.
It also prepares for retrieving the right X, Y and tick-values from the information we need to display by supplying get-functions.
- getX: The exponential X-axes is defined to be the base-value to
the power of the measured value. This is done via
Pow. - getTicks: As the ticks don't automatically adapt, I need to do
the same thing as well, making a dictionary for X-values to
labels. In R I would use at= in the function axis, but
go-charthas a different API. - getY: like in the origing R-code, I subtract inflation from the relative difference of GDP's.▮
The main package
Every GO program has some babble at the beginning and the end. Interaction with the environment is not what this title is about, but at the end I want to show something4
package main
<<imports>>
<<gdpinfo>>
func main() {
  graph :=
    <<define the chart>>
  f, err := os.Create( <<chartfile>> )
  if err == nil {
    defer f.Close()
    wrt := bufio.NewWriter( f )
    defer wrt.Flush()

    graph.Render( chart.PNG, wrt )

  } else {
    panic( err )
  }
  fmt.Printf( <<chartfile>> )
}
Then a png
file is opened for writing and the rendering takes place. I tried
SVG, but had no succes, hence PNG.
Note that I use defer twice. The statements are executed in a
last-in-first-out order. Without the wrt.Flush(), the image ends
up incomplete in the file.▮
More GO babble
import (
    "github.com/go-pg/pg"
    "github.com/wcharczuk/go-chart"
    "bufio"
    "fmt"
    "os"
    "math"
)
What's the point?
This title is an exercise in using GO for making charts. One of the bad parts of R is memory-use. Because of the way R works and packages are designed, there are lots of temporary arrays. I hoped that GO, together with the right packages, could solve this. Callbacks are great for providing this (or, but this goes beyond my grasp, channels may even be better).
GO can solve this, but the available API's haven't yet.
This exercise is not about using GO for data science; there are far too little packages for analysing data in GO. R functionally outperforms GO in thousand of ways.
Having said that, most R modules are written in C, porting these to GO packages is a terrible task, but can be automated (or wrapped). Wouldn't it be great to use CRAN for automatically importing GO modules?
GO is a nice language (apart from the rule about exported symbols: if they start with a capital, they will be, otherwise they don't. It's even sillier than the white-space in Python) and it has great potential, let alone for the speed of running and, this was a surprise to me, compilation.
about this title
The document to generate the scripts has the same source as the document you are reading now.
Most scripts are bare bone, the amount of fancy stuff is kept to an absolute minimum in order to present only the concepts at hand and only that.
This title was written between 28th of September and 1st of Octobre 2017.